

Original article ISPreview UK:Read More
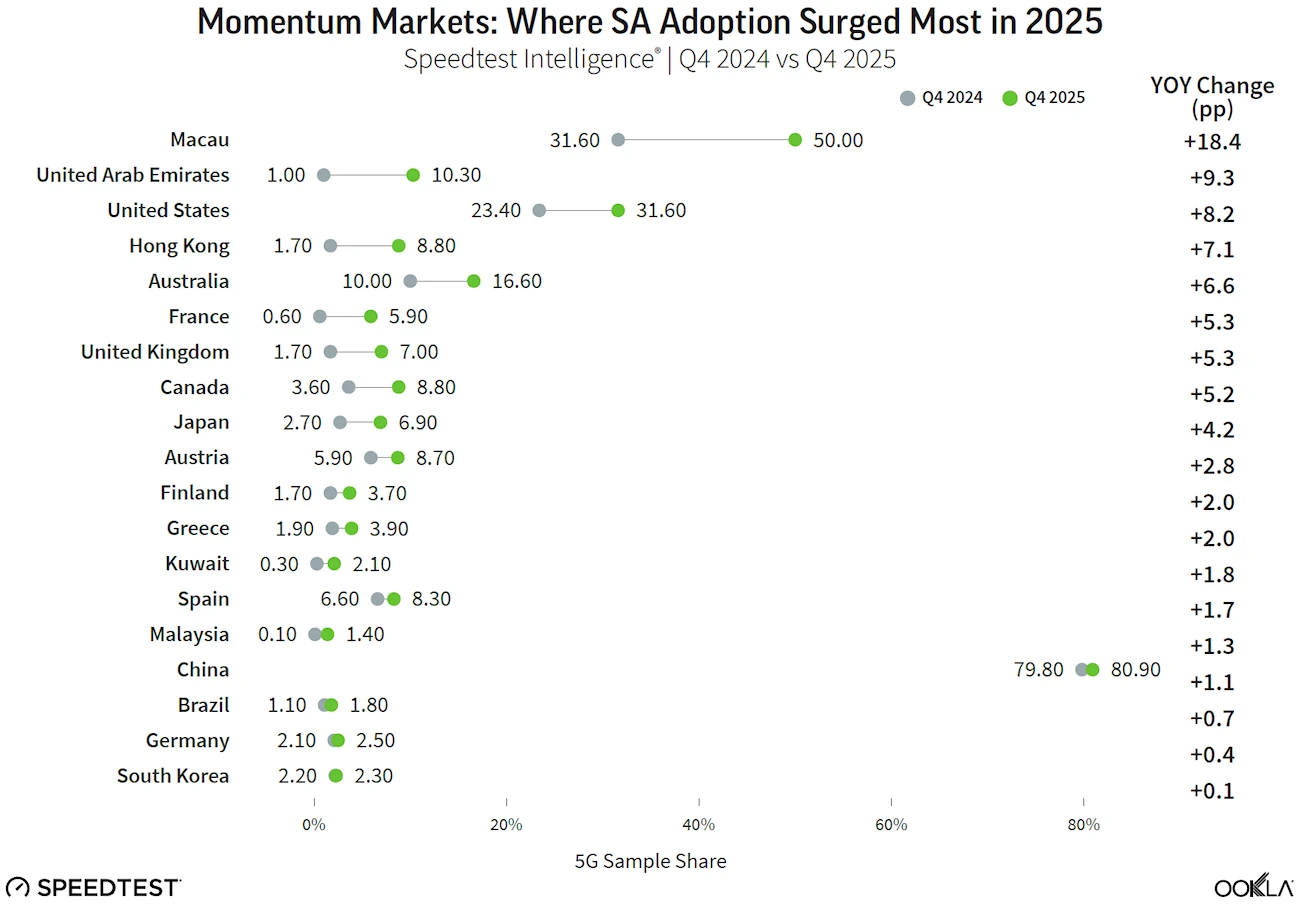
A new study into the global progress of 5G Standalone mobile broadband networks, which was conducted by Ookla, has revealed that global 5G SA availability – based on Speedtest.net sample share – reached 17.6% in Q4 2025 (i.e. one in six 5G speed tests were conducted on SA networks). The UK was also identified as an accelerator and saw its share rise from 1.7% to 7% in the last year.
Just for some context. Earlier deployments of 5G were largely Non-Standalone (NSA), which meant they were partly reliant upon slower 4G infrastructure. But Standalone (SA) networks, which are rapidly growing their coverage, are pure end-to-end 5G that can deliver ultra-low latency times, greater energy efficiency, better mobile broadband speeds (particularly uploads), network slicing, improved support for Internet of Things (IoT) devices, increased reliability and security etc.
The new report highlights how, at the country level, the USA remains the largest accelerator, with its 5G SA sample share rising from 23.4% in Q4 2024 to 31.6% in Q4 2025 (+8.2 pp). Singapore remains among the highest-SA-share markets globally at 38.9% in Q4 2025, but was broadly flat year-on-year. Other notable accelerators included Hong Kong (+7.1 pp to 8.8%) and the United Kingdom (+5.3 pp to 7%).
Just for some context. Europe’s 5G SA sample share still remains generally low, but it did more than double from 1.1% to 2.8% over the past year, primarily driven by accelerated deployments in Austria (8.7%), Spain (8.3%), the UK (7%), and France (5.9%). Spain’s 5G SA share is comparatively high in Europe, but its year-on-year increase was more modest (+1.7 pp).
5G Mobile Broadband Speeds
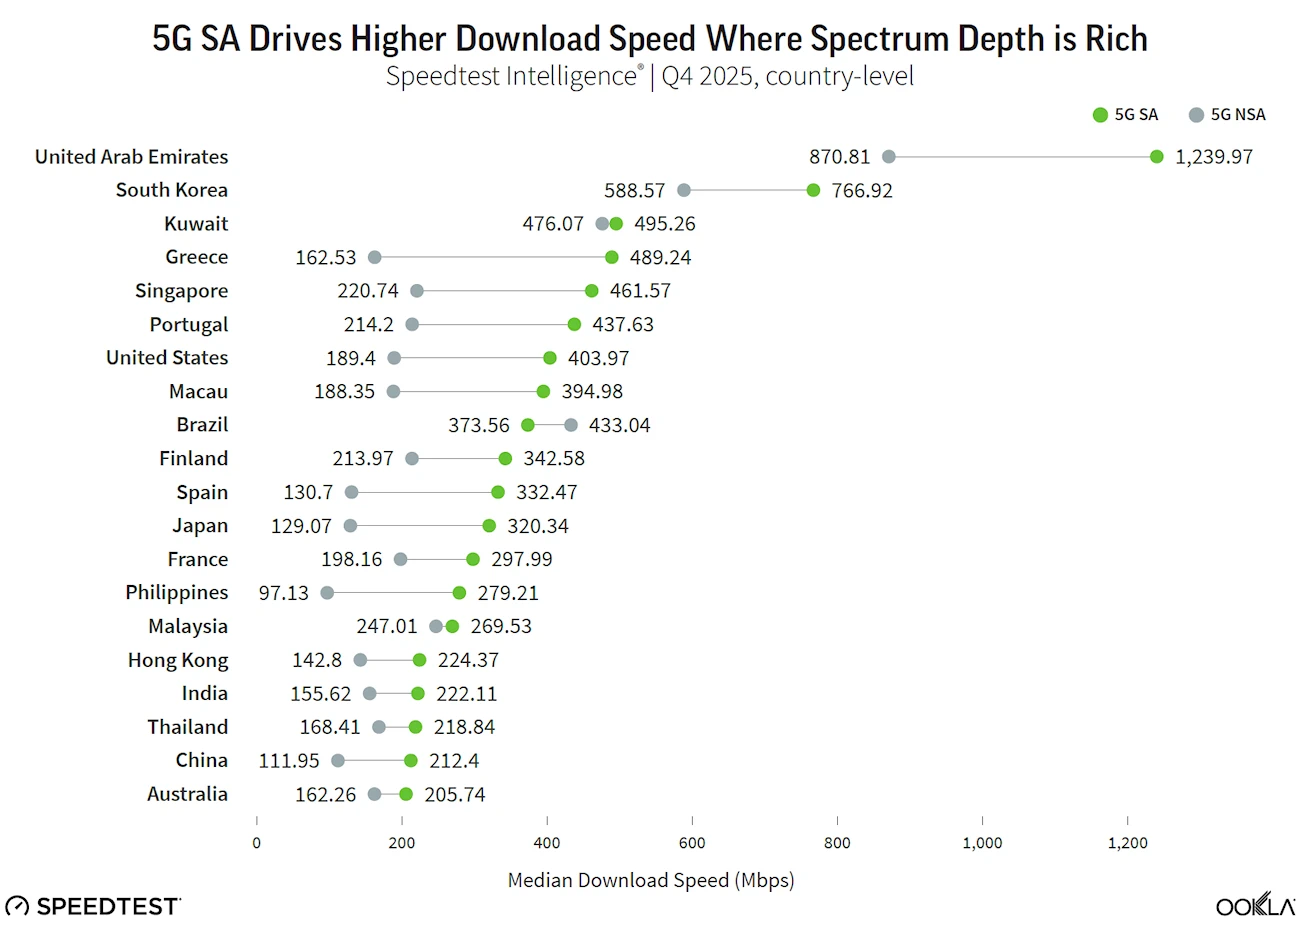
In terms of the impact upon mobile broadband speeds of 5G SA technology. Ookla noted how, globally, 5G SA connections delivered a median download speed of 269.51Mbps (or just 205Mbps in Europe), representing a 52% premium over older 5G NSA’s 177.37Mbps (or 45% faster than NSA in Europe). But that 269.51Mbps figure is actually down by 3.5% from 279.25Mbps last year.
However, there are plenty of significant regional variations in all this, such as with the countries of the Gulf Cooperation Council (GCC), which delivered a median download speed of 1.13Gbps! Similarly, the UAE leads median 5G SA download speeds globally at 1.24Gbps, a speed that would be considered exceptional even for many full fibre (FTTP) broadband lines in developed markets.
As for the United Kingdom, Ookla’s report found that we delivered a median download speed of 142Mbps via 5G SA, which makes us one of the slowest countries in the entire study. Sadly there are no comparative figures for 5G NSA in the UK as we’re not even fast enough to make their downloads table (below).
The performance gaps between NSA and SA 5G typically reflect continued reliance on low-band spectrum (particularly in Germany) and limited mid-band deployment for SA networks.
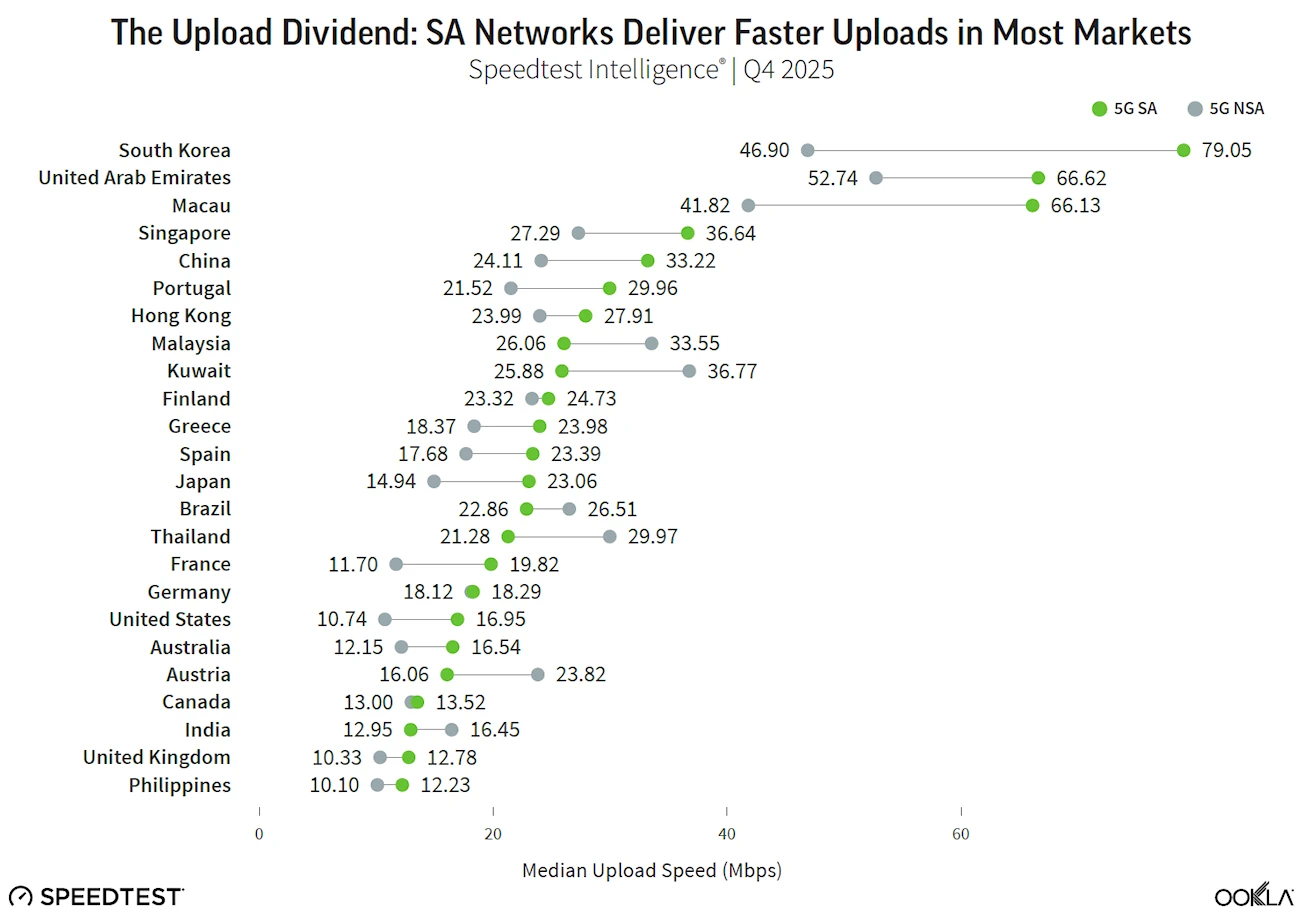
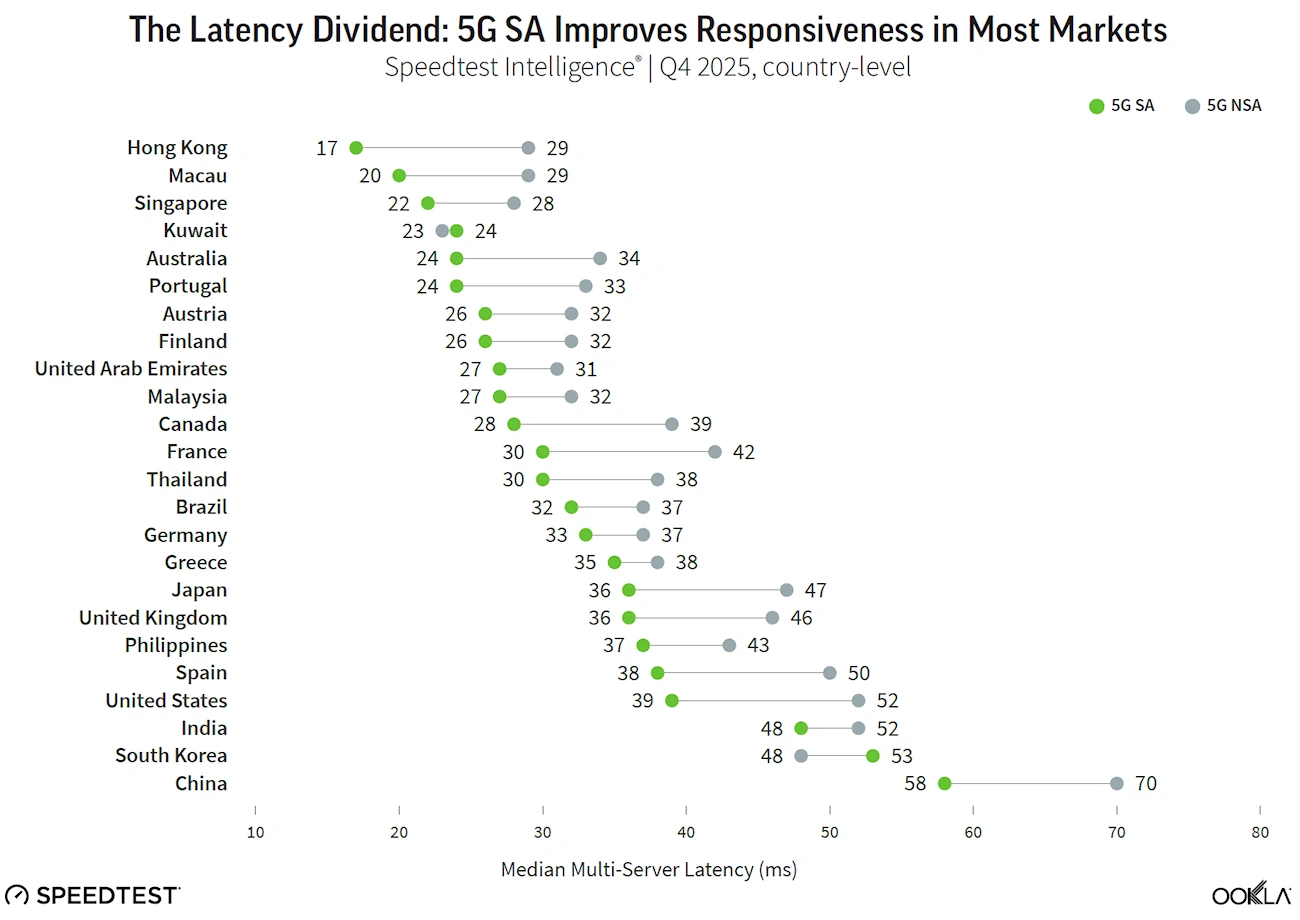
The global median upload speed similarly slipped 4.6% to 16.91Mbps over the same period, while latency times improved by over 6% to 42ms (milliseconds). As for the United Kingdom, we were once again at the bottom of the upstream table but did show that NSA 5G networks delivered an upload rate of 10.33Mbps, while 5G SA achieved slightly higher at 12.78Mbps. Not exactly earth-shattering stuff on the upstream front.
In terms of latency performance, the average UK latency times on 5G SA networks were just 36ms, which compares with 46ms on NSA.
The good news is that some countries have implemented clear coverage obligations linked to 5G SA and others have seen a boost from network consolidation, such as in the UK at both operator level (e.g. VodafoneThree’s commitments) and government level (e.g the UK’s 5GSA target for 2030). Ookla highlights how such countries often show “substantially higher SA adoption and performance than countries with fragmented or reactive policy approaches“.
Despite these advances, further progress is still required. In many countries the planning system remains a constraint, with approval timelines for new masts, small cells, and other infrastructure representing a bottleneck that, if addressed, Ookla says “could materially accelerate deployment“. The UK is making progress on this front (here and here), although it has taken a long time.
Finally, the report also highlighted some early evidence to suggest that 5G SA networks may reduce battery drain vs NSA networks, which is a claim we’ve seen before. The battery consumption analysis employed a proprietary Ookla methodology that passively analyses battery level readings collected from Android devices via Speedtest background scans. The methodology filters out periods of device charging and statistically anomalous intervals, isolating valid discharge measurements.
In the UK sample, devices connected to 5G SA on the EE network recorded a median discharge time approximately 22% longer than those on 5G NSA. On O2 UK, the SA advantage was also evident, with SA devices lasting around 11% longer than their NSA counterparts. In practical terms, these percentage gains translated to differences of up to around 3 hours in median battery endurance between the two architectures, depending on the operator.